Three essential retailing concepts that will pop out in every conversation around Forecasting Demand are Sell In vs Sell Out, and Sell Through Rate.
For any retailer, forecasting demand is directly linked to profitability as they risk losing money via Lost Sales or discounting products to reduce overstocks. And, this presents a perfect Catch-22 situation as Too High or Too Low Sell Through rates could lead to massive overstocks as well as OOS (Out-of-Stocks).
And to prevent this, they need to know the answers to three crucial questions-
➤ WHEN to Order
➤ HOW much to Order
➤ HOW long it will take to sell those
Let us start with simple definitions first!
- Sell In: number of Units of a product that a manufacturer is selling into the Distributor (Refer the Infographic below)
- Sell Through: Sell-through is sales from the Manufacturer/Distributors to the Retailer
- Sell Out: number of units of a product the Retailer ends up selling to the end customer

What is Sell Through Rate?
Sell Through rate, expressed as a percentage, measures how much of the inventory that the Retailer received got sold to end consumers—over a set period, typically a month. This widely used and effective Key Performance Indicator (KPI) for the retail industry gives a great indication of how quickly they can sell the products available on their shelves and turn that into revenue. If the Sell-Through Rate is too high or too low, this KPI can help the Retailer make necessary tweaks and further optimize their strategy based on demand.
FORMULA FOR SELL THROUGH RATE CALCULATION:
To calculate the Sell-through rate, we use a straightforward formula, typically done monthly.
- Sell Through Rate = (UNITS SOLD/ UNITS RECEIVED) x 100 or,
- Sell Through Rate = (UNITS SOLD / (UNITS ON HAND + UNITS SOLD)) x 100
PRACTICAL EXAMPLE:
CAFÉ MOJO is a local Coffeehouse serving gourmet coffee and bakes goods. As part of their improved inventory management initiative, the Café is trying to keep track of their store’s Sell-Through rates.
In January, the Café received 1000 units of coffee products from its suppliers and sold 850 units of coffee products. The Sell-Through rate for January will be-
Sell through rate = (850 / 1000) x 100 = 85%
In February, the Café received 1500 units of coffee products from its suppliers and sold 1200 units of coffee products.
Sell through rate = (1200 / 1500) x 100 = 80%
In Summary, the Sell-Through rate for both January and February will be as follows-
Sell Through Rate:
Jan – 85%
Feb – 80% ▽
In this example, the Café can use either of the two strategies to optimize their inventory for subsequent months-
- Order Less from the suppliers to improve Sell-Through rates or,
- Run Promotions to sell additional units and maintain their targeted Sell-Through rates.
KEY TAKEAWAYS:
Analysts within the retailer team can analyze Sell Through data with various deep-dives, and understanding of the market trends and consumers’ pulse. They can-
- Compare Sell through of products in Stores within a ZIP code; check how demographics and income levels impact results
- Are there any seasonal trends for the products? Or any brand loyalty that skews results?
- Identify products with the best performance and re-strategize on poor performers.
- Perform deeper analysis at Category level to see product performance at Product lines and Manufacturer level.
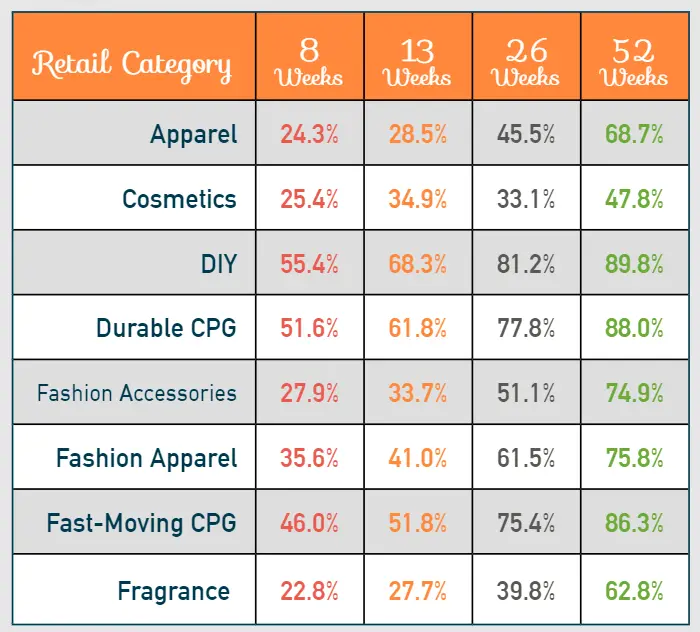
TYPICAL SELL THROUGH RATES BENCHMARK: (Courtesy AcceleratedAnalytics)


